Why Identical LED Grow Lights Deliver Different Results? Unveiling the 5 Hidden Factors Affecting PPFD Performance
Have you ever faced this puzzle?
You bought two grow lights with identical LED chip counts, chip models, and the grow light wattage—yet their PPFD test results vary dramatically. Or perhaps two fixtures with matching labeled wattages produced noticeably different crop yields under their illumination. The hidden culprit? The real-world performance of PPFD (Photosynthetic Photon Flux Density).
While PPFD is the gold standard for evaluating grow light performance, why do “identical” fixtures deliver inconsistent PPFD values? We’ll dissect five critical factors behind this industry mystery and offer actionable insights for growers.
Table of Contents
- The Top 6 Causes of Plant Scorching
- No. 1 Cause: Excessive Nutrition – 90% of Beginners Over-fertilize
- The Harm of Over-fertilizing
- Tips for Fertilizing Correctly
- No. 2 Cause: High Temperature – The Lethal Effects of High Environmental Temperature
- How High Temperatures Harm Plants
- Effective Ways to Lower Temperatures
- No. 3 Cause: Overheating Lights – The Silent Killer of Scorched Plants
- The Impact of Overheated Lights on Plants
- How to Keep Grow Lights from Overheating
- No. 4 Cause: Prolonged Lighting – How Many Hours Are Safe for Plants?
- Negative Effects of Excessive Light
- How to Control Light Duration Effectively
- No. 5 Cause: Hanging Distance – Are Your Grow Lights Too Close?
- The Risks of Improper Hanging Distance
- How to Adjust Grow Light Distance
- No. 6 Cause: Light Burn: Why Higher PPFD Isn’t Always Better?
- The Risks of Excessive PPFD
- How to Optimize PPFD for Healthy Growth
- Does the Spectrum of LED Grow Lights Cause Plant Burn?
- Conclusion
1.LED Current-Voltage Discrepancies
Why do grow lights with identical specs show vastly different PPFD? Beyond LED chip models themselves, current & voltage stability, and LED quality grading hold the key.
(1) Aluminum Substrate Circuit Design
The circuit layout on aluminum substrates directly impacts LED performance. Poor designs (like excessive trace lengths or uneven copper thickness) create voltage differences between LEDs on the same board. For instance:
- The LED chip near the power inputs may receive 12V
- The LED chip away from the power inputs might drop to 11.5V due to line losses.
This “voltage drop” creates brightness stratification – front LEDs show higher PPFD values while rear ones underperform, resulting in uneven PPFD distribution across the fixture.

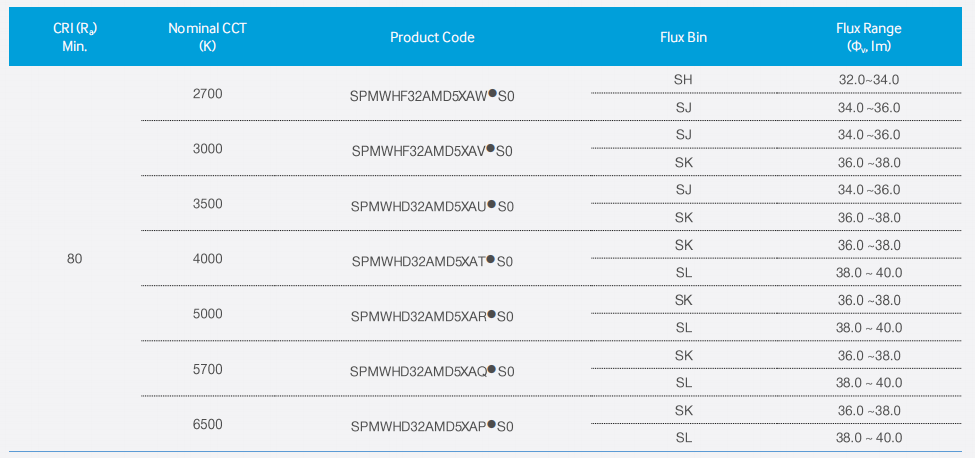
(2) The Overlooked LED BIN Grading
Even industry-standard LEDs like Samsung have strict quality tiers. The same model is divided into U1/U2/U3 BIN grades according to luminous efficiency, with performance gaps exceeding 10%.
Some manufacturers cut costs by using lower BIN-grade LEDs: they use U3 BIN-grade lamp beads, however, the value of U1 BIN-grade lamp beads is 15% higher than that of the same specification products using U3 BIN-grade.
This explains why “same specs ≠ same results” occurs frequently.
See the LED BIN grading chart below:
2.Measurement Tools Matter
PPFD accuracy heavily depends on your testing equipment. The market offers devices ranging from budget-friendly (under $100) to professional-grade systems costing tens of thousands, but not all tools deliver equal results. Cheap spectrometers often show significant deviations compared to professional instruments.
Let’s break down the best tools for different user groups:
(1) Beginners & Home Growers – Mobile Apps
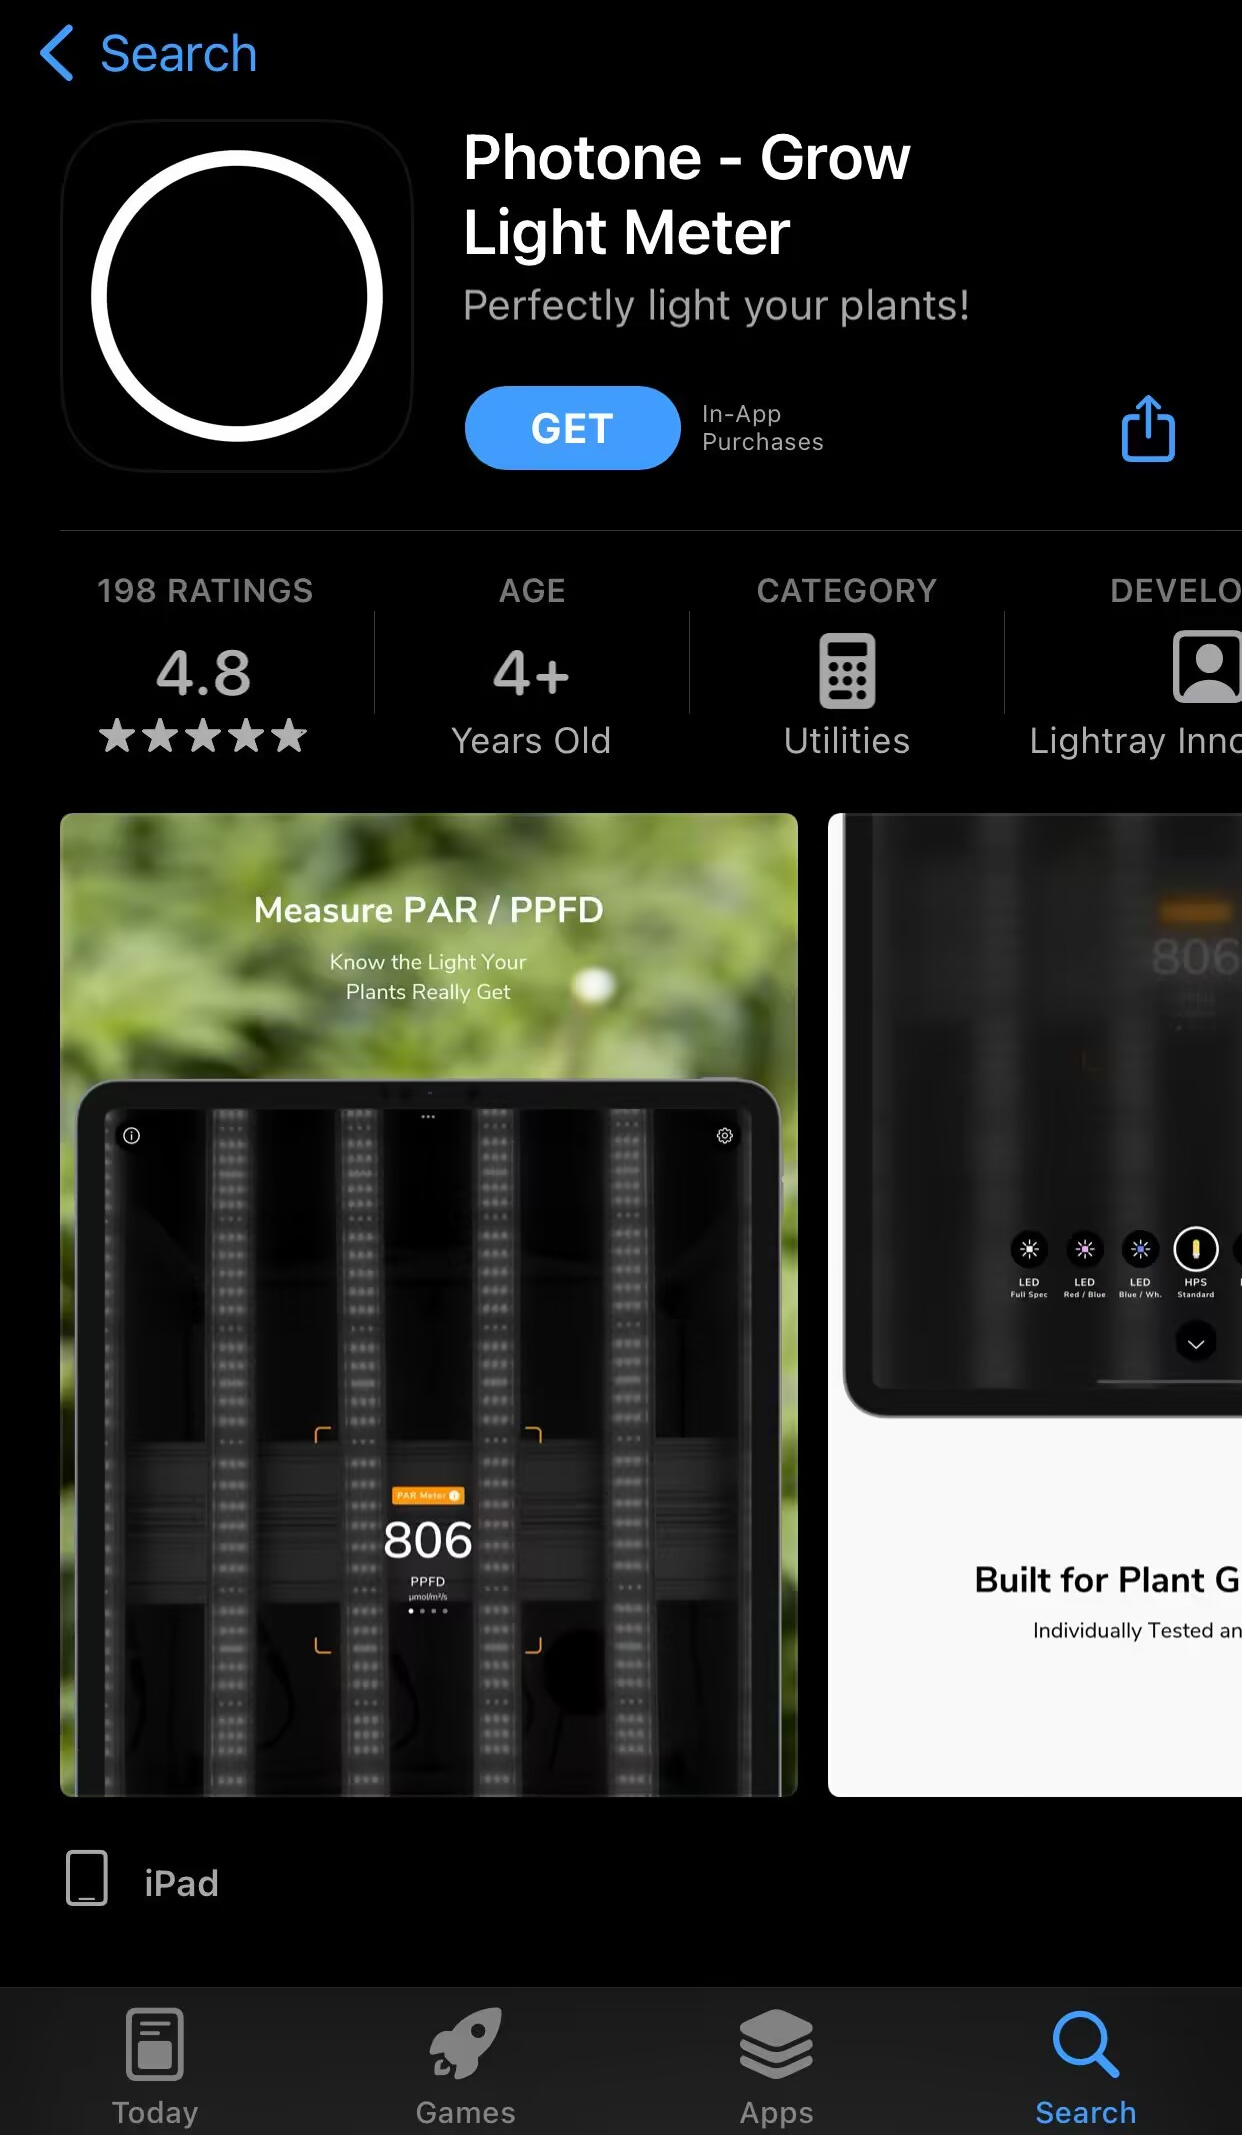
New growers can start with free apps like Photone available on app stores. Using your smartphone’s light sensor, these apps provide quick PPFD estimates for basic checks.
- Pros:Instant readings, zero cost, user-friendly
- Limits:±15% accuracy, unsuitable for commercial operations
- Best for:Spot-checking home grow tents or small setups
Photone’s algorithm-enhanced measurements offer a practical starting point, but serious growers will need better and more professional tools.
(2) Commercial Growers & Enthusiasts – Handheld Systems
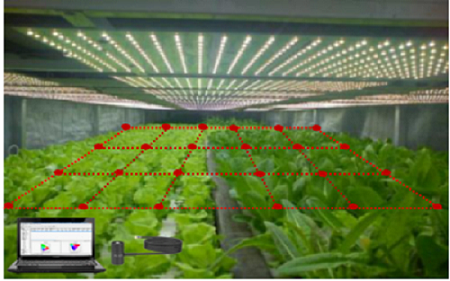
Commercial growers or gardening enthusiasts usually grow their plants in indoor fields or greenhouses. They have stricter requirements for lighting and require higher PPFD accuracy. Therefore, they usually use grow light analyzers – handheld spectrum testers, spectrometer(about $100-$2000), and even use plant photosynthetic quantum sensors (about $30-$150), which are also the most common and widely used test instruments and methods.
In a controllable environment, combined with crop characteristics, single-point or regional multi-point measurements are performed, data is dynamically recorded, and distribution maps are drawn.
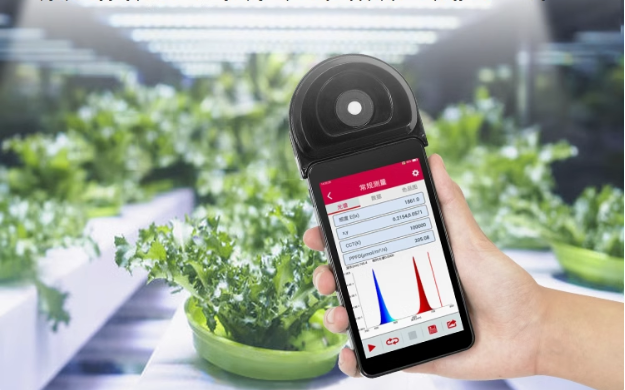
Key features:
- 5% measurement accuracy
- Multi-point mapping
- Real-time data logging
- Compact design for indoor cultivation
Ideal for:
- Optimizing light recipes in vertical farms
- Comparing fixture performance
- Maintaining consistent PPFD across grow zones


(3) Industrial & Research Applications – Robot Distribution Test System
In industrial-level planting or experimental research, professional growers and researchers have extremely high requirements for the performance of plant lamps. In order to ensure the maximum yield of industrial planting or the scientific rigor of experimental research, they often need to use high-precision mechanical instruments for testing. The high-precision mechanical distribution test system came into being.
The high-precision mechanical distribution test system is a comprehensive test system (about $12000-$42000), which comprehensively measures the spatial light distribution performance of plant lamps according to the light distribution of plant lamps at different positions and angles in space.


Install a spectrometer and optical fiber in a darkroom. Test the color temperature and light intensity distribution in a darkroom while testing the PPFD. This is generally used in industrial laboratory photometric parameter measurements.

Key features:
- 360° spatial analysis
- 1% measurement precision
- Darkroom-calibrated results
- Full spectrum profiling
Typical users:
- Cannabis production facilities
- LED manufacturers
- Agricultural research labs
3.Driver Efficiency
When LED chips meet spec, the driver conversion efficiency becomes the invisible battlefield to determine PPFD. A counterintuitive fact is that a grow light might only deliver 910W of actual light power – nearly 10% of the energy has been lost.
(1) Bigger Drivers = Better Performance
Through comparative tests, we found that different drivers, although with the same power, will lead to different results due to actual conversion efficiency.
Refer to the following Driver Efficiency Comparison Table1:
| Driver Wattage | Efficiency |
| 100W | 91% |
| 150W | 91% |
| 200W | 91% |
| 240W | 91.5% |
| 320W | 92.5% |
| 400W | 93.5% |
| 600W | 94.5% |
| 800W | 95% |
| 1000W | 95% |
| 1200W | 95% |
Real-world example:
Two 1000W fixtures using different driver configurations:
1×1000W driver: 1000×0.95 = 950W
5×200W drivers: 5×200×0.91 = 910W
Our tests reveal:
- Single 1000W driver:reach 95% efficiency → actual luminous power 950W
- Five 200W drivers: only 91% efficiency due to multiple conversion losses → total luminous power 910W
This 4.4% efficiency gap means a loss of 20μmol photons per square meter per second, which leads to significant differences in crop yields in the long term.
(2) Isolated vs. Non-Isolated Drivers
Non-isolated drivers typically offer 3-5% higher efficiency through simpler circuitry.
For example, a 1000W non-isolated driver has an efficiency of 97%, while an isolated driver of the same power has an efficiency of only 95%. However, it should be noted that non-isolated drivers have higher safety requirements, and growers need to weigh their choices based on the usage scenario.
Best Practice:
- Better moisture resistance
Greenhouses/Humid: Certified isolated drivers (Safety first)
- Higher efficiency
Controlled facilities: Non-isolated drivers (Maximize efficiency)
Refer to the following Driver Efficiency Comparison Table2:
| Isolated Drivers | Efficiency | Non-Isolated Drivers | Efficiency |
| 100W | 91% | 100W | 95% |
| 240W | 91.5% | 240W | 95% |
| 320W | 92.5% | 320W | 95% |
| 400W | 93.5% | 400W | 96% |
| 600W | 94.5% | 600W | 96% |
| 800W | 95% | 800W | 96.5% |
| 1000W | 95% | 1000W | 97% |
| 1200W | 95% | 1200W | 97% |
4.Testing Environment
PPFD (Photosynthetic Photon Flux Density) measures photons per second per square meter (μmol/m²/s) and serves as the gold standard for evaluating grow light performance. However, environmental factors can significantly distort PPFD readings. Here’s what you need to control:
(1) Ambient Light Contamination
When measuring PPFD, other light sources (sunlight, room lights) in the environment may interfere with the measurement results.
Therefore, always test in a light-sealed darkroom to ensure accuracy.
(2) Surface Reflectivity
The surface material and color of the test environment will affect the reflectivity of light, thus affecting the PPFD measurement.
Surfaces with high reflectivity will reflect more light to the measurement area, resulting in higher PPFD readings. Conversely, surfaces with low reflectivity will absorb more light, resulting in lower readings.
Therefore, Maintain uniform reflectivity across the testing space.
(3) Temperature & Humidity
Although temperature and humidity have little direct effect on the number of photons, they may affect the performance of the measurement equipment and thus the PPFD measurement results.
Therefore, Keep conditions within device specs.
(4) Light-Sensor Distance
The PPFD value is inversely proportional to the square of the distance between the light source and the measurement point.
Therefore, the distance between the luminaire and the measurement point should be strictly controlled during measurement to ensure consistency. Even 5cm differences matter.
(5) Equipment Calibration
The accuracy of the measuring equipment directly affects the measurement results of PPFD. Regularly calibrating the measuring equipment to ensure it works within the specified accuracy range is the key to obtaining accurate measurement results.
(6) Clean Testing Environment
Dust, dirt, and other pollutants may affect the propagation and reflection of light, thus affecting the PPFD measurement results. Keeping the test environment clean and avoiding interference from pollutants will help improve the accuracy of the measurement.
5.LED Chips Layout Design
Even if all hardware parameters are the same, the spatial layout of the lamp chips can still cause PPFD to fluctuate by more than 30%, which is a key factor affecting the uniform growth of crops.
(1) The Pitfall of Uniform Arrangement
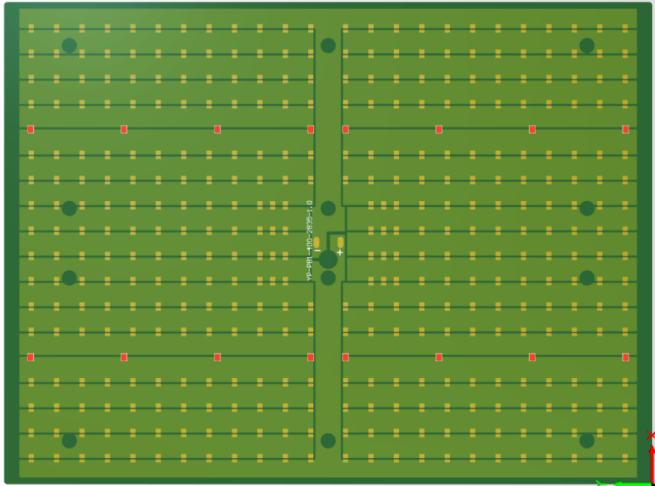
The grow light features a Checkboard-style layout, evenly spaced LED layout (as shown in Figure 1). At first, this design was expected to provide uniform lighting. The central PPFD readings appeared to meet the standard, giving seemingly good results. However, actual testing revealed the opposite.
Figure 1:Traditional LED chip layout diagram
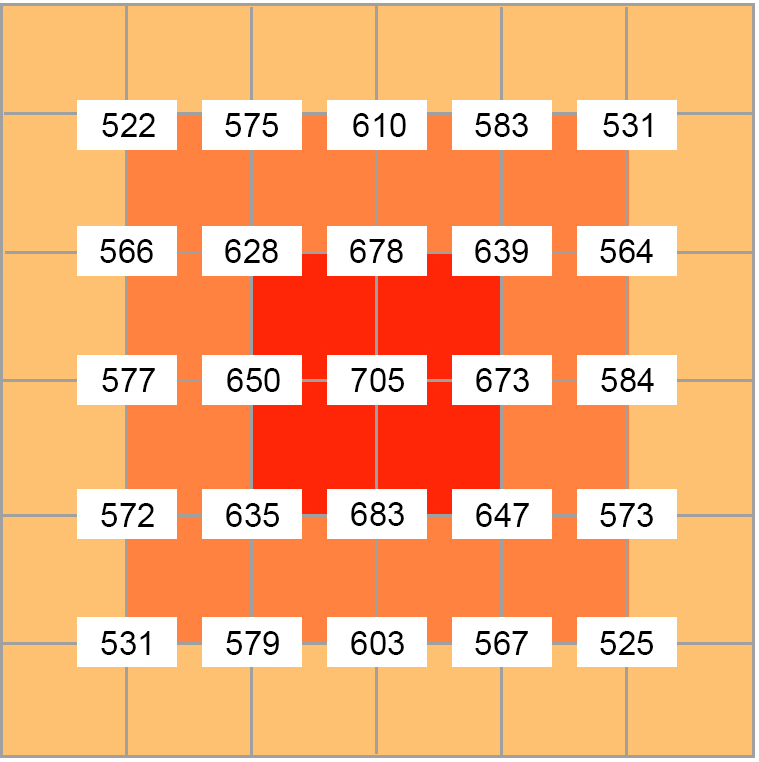
Looking at the overall illumination, the PPF values gradually decreased from the center to the edges (as shown in Figure 2). This imbalance means that if multiple plants are grown together, those in the center will become overcrowded, while those at the edges will struggle to grow. In reality, this setup does not achieve true uniform lighting, which negatively impacts overall plant growth and yield.
Figure 2:PPFD Map
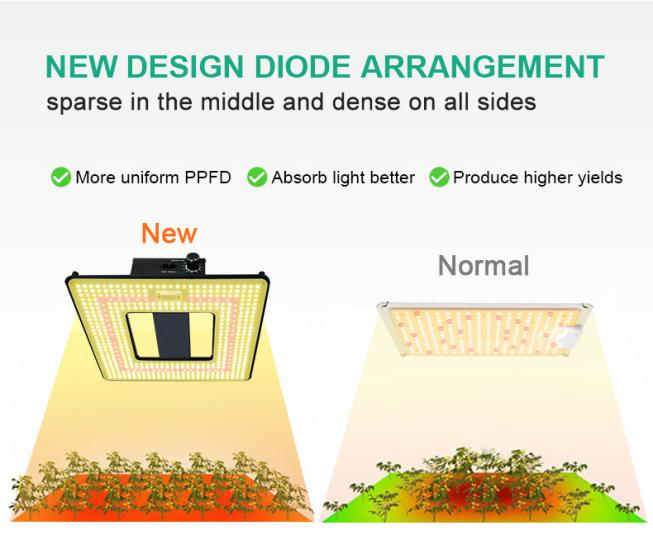
(2) Innovative Layout Arrangement: Sparse Center, Dense Edges
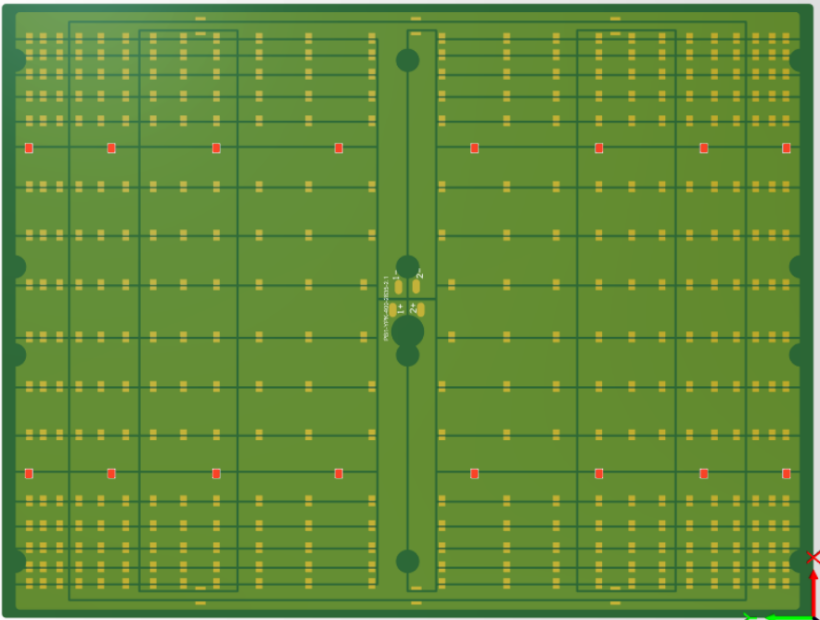
The “ring arrangement” design (dense at the edge/sparse in the center) (as shown in Figure 3) may look unusual and raise doubts.
Figure 3:Innovative LED chip layout diagram
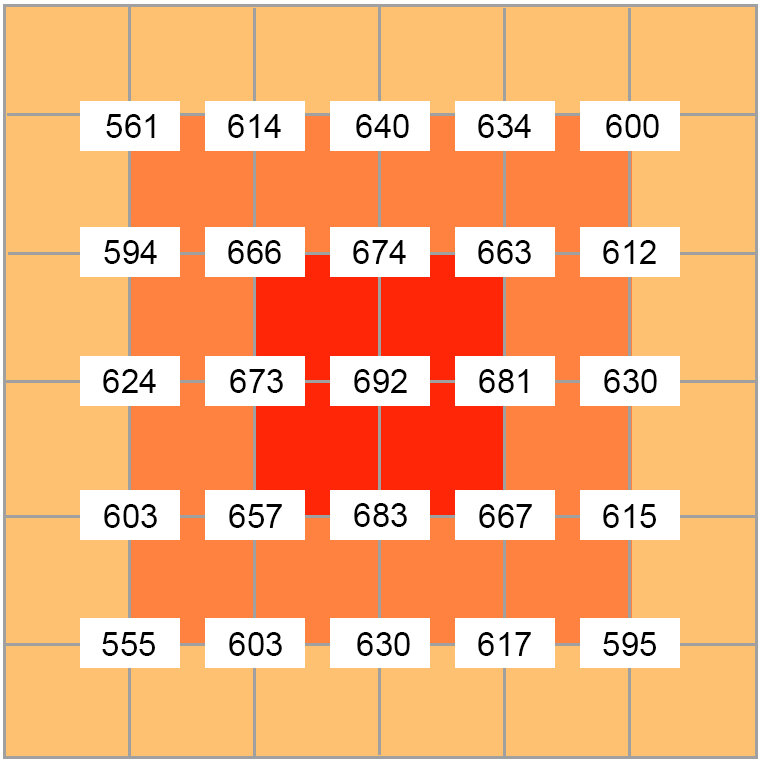
However, real-world testing proves its effectiveness. The PPFD difference between the center and edges stays within ±8%, ensuring even light distribution across all parts of the plants. The tested PPF values also confirm a stable overall lighting level (as shown in Figure 4).
Figure 4:PPFD Map
(3) The Economic Value of a Scientific Layout
Optimizing the density of lamp beads based on the lighting distance can significantly improve light energy efficiency. For example, in a 1.2m shelf growing setup, using a gradient arrangement (fewer lamp chips in the center and more at the edges) combined with a 120° beam angle, can increase PPFD uniformity up to 92%, which is 15%-20% higher than traditional designs.
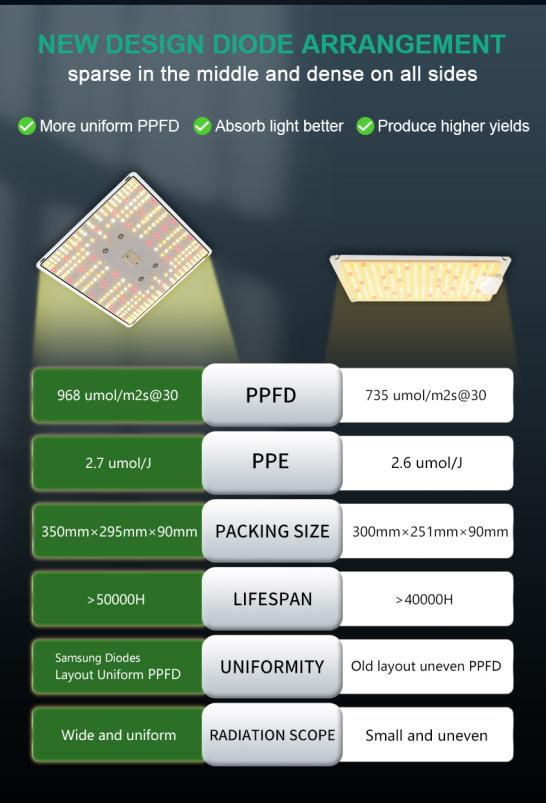
This is why professional growers are willing to invest in customized, scientifically designed lamp bead layouts. I recommend BATA LED’s new PB series and square quantum board series, which feature an innovative lamp bead arrangement. This design delivers a more even lighting distribution and PPFD compared with traditional layouts, maximizing plant growth efficiency.
Final Takeaway
The PPFD performance of grow lights isn’t just about “number of LED chips × power.” Many factors quietly influence the final lighting effect, including circuit design losses, variations in LED BIN-grade, driver efficiency, test environment conditions, test instrument, and LED chip layout arrangement.
For growers, consider not just the LED chips and drivers, but also the arrangement of LED chips, testing equipment, and testing environment for multi-dimensional evaluation to ensure optimal performance.
CATEGORIES
Recommended Post

Where It’s Legal to Grow Cannabis: Ultimate Tips & Cultivation Laws
About Author—Jose Li
Jose, a senior content creator at BATA LED, brings over 5 years of expertise in LED grow light. He delivers valuable insights to help growers and farmers better understand LED grow light technology, empowering them to boost crop yields and quality with advanced lighting solutions.
