The Myth of 3.0 μmol/J: Can Grow Lights Really Deliver Such High Photon Efficacy?
When “full spectrum grow lights” selling 10,000 units/month on e-commerce platforms cost only
1,000 – both claiming the same 3.0 μmol/J PPE (Photosynthetic Photon Efficacy) – what industry secrets lie behind this 10x price gap?
Let’s reveal the truth through three key aspects: overall performance, materials/manufacturing, and testing protocols.
Overall Performance
Choosing LED grow lights requires more than specs or price alone. Growers should comprehensively evaluate products through cost-value analysis, marketing authenticity verification, and spectral analysis.
Price vs Quality
High-performance LED grow lights require branded components and advanced manufacturing. However, some suppliers maximize profits using substandard materials – like no-name LEDs costing 1/3 of Samsung diodes, compromising lifespan and efficacy.
When two 3.0 μmol/J grow lights carry 10x price difference (
1,000), how to choose?
Verification Tips:
• Request official test reports
• Verify component certifications/authorizations
• Obtain samples for performance testing
Misleading Claims (Internal link: “How to Avoid Pitfalls When Choosing Grow Lights”)
The market faces rampant issues:
• False wattage claims
• Counterfeit diodes
• Unauthorized “Samsung/Osram” knockoffs
• Using lab-optimized single-chip peak values (e.g., 3.2 μmol/J) as whole-fixture specs
8 Supplier Screening Tips:
-
Check qualifications (prefer 5+ year manufacturers)
-
Verify factory scale (expose small workshops)
-
Authenticate diodes (detect fake Samsung/Osram)
-
Select proper drivers
-
Eliminate poor craftsmanship
-
Inspect production equipment
-
Test sales team expertise
-
Demand case studies over marketing stories
Light Spectrum
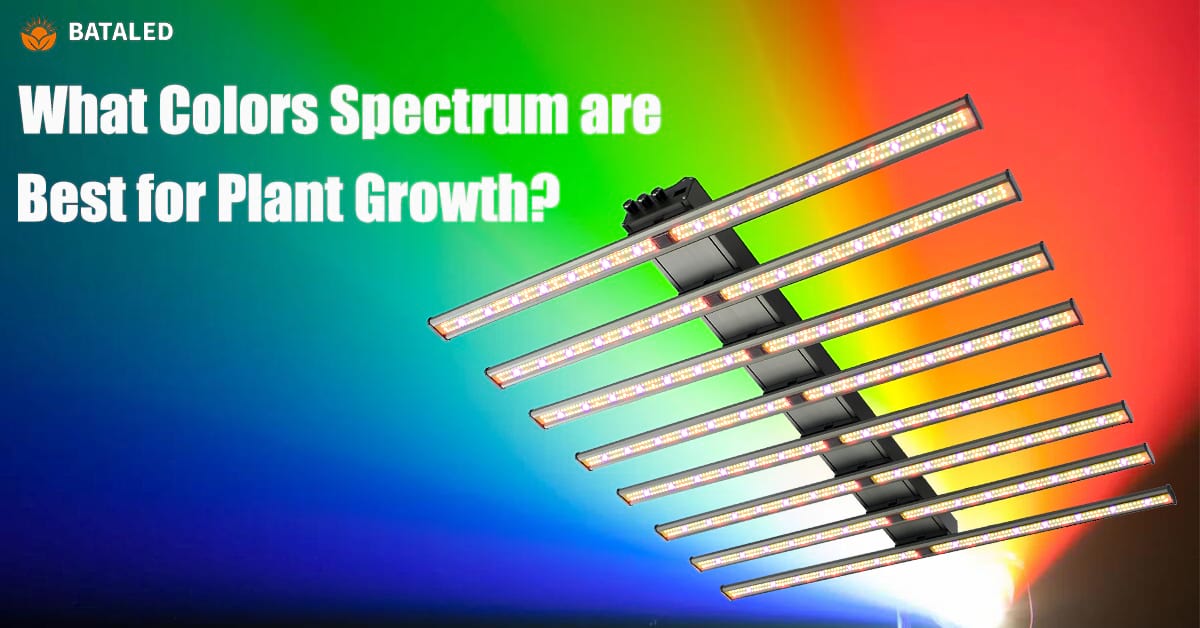
Avoid overemphasizing PPE. While 3.0 μmol/J looks impressive, spectral distribution (400-700nm) determines plant response:
UV Spectrum (280-400nm)
• UV-B (280-315nm): Activates UVR8 receptors, boosts secondary metabolites (anthocyanins), enhances stress resistance (excess inhibits growth)
• UV-A (315-400nm): Synergizes with blue light via cryptochromes, regulates stomata/chloroplast movement
Blue Light (400-500nm, peak 450nm)
• Chlorophyll synthesis
• Root/leaf development (critical for seedlings)
• Prevents leggy growth
Red Light (600-700nm, peak 660nm)
• Drives photosynthesis (highest efficiency)
• Accelerates flowering/fruiting via phytochromes
• Promotes vertical growth (balance with blue)
Far-Red (700-750nm, peak 730nm)
• Regulates photoperiod responses
• Enhances shade avoidance/flowering timing
• Simulates dawn/dusk transitions
Full-spectrum optimization:
• Seedlings: Higher blue ratio
• Vegetative: Balanced red/blue
• Flowering: Increased red/far-red
Materials & Manufacturing
Achieving 3.0 μmol/J PPE requires precision engineering at every stage – from LED chips to driver efficiency and optical design.
LED Chip Selection
Brand Matters
Counterfeit/no-name LEDs (1/3 cost of genuine Samsung/Osram) show:
• Short lifespan
• Unstable output
• Actual PPE ≤2.4 μmol/J
Chip Size Impacts
Larger chips (e.g., 40mil vs 30mil):
• Handle higher currents
• Reduce thermal droop
• Maintain stable efficacy
Example: Samsung LM301H EVO outperforms LH281H through improved thermal design
Radiation Output
Premium chips deliver higher PPF:
• Osram OSLON Square: 4.04 μmol/J @700mA
Thermal Management
Larger chips + copper substrates > aluminum:
• Osram’s ceramic packaging ensures ≤2% annual lumen depreciation
Driver Efficiency
Driver losses directly impact final PPE:
Power Scaling Advantage
| Driver Power | Efficiency |
|---|---|
| 200W | 91% |
| 1000W | 95% |
| Single 1000W driver delivers 40W more output than 5x200W units |
Isolated vs Non-Isolated
| Type | Efficiency | Safety |
|---|---|---|
| Non-Isolated | 97% | Dry environments |
| Isolated | 95% | Humid greenhouses |
Lens Transparency
Optical losses through lenses:
| Material | Transmittance | Best For |
|---|---|---|
| Glass | 92% | High-precision |
| PMMA | 93% | Low-power |
| PC Cover | 87% | General purpose |
Example: 3.3 μmol/J chip → 2.87 μmol/J through PC lens
Circuit Design
Poor PCB layout causes voltage drop (e.g., 12V→11.5V across board):
• Inconsistent brightness
• PPE reduction up to 8%
Testing Protocols
Testing Equipment
• Lab-grade: Integrating spheres (accurate PPF/PPE)
• Commercial: Quantum PAR meters (field measurements)
Testing Methods
Integrating Sphere Protocol
-
Clean sphere interior
-
Calibrate equipment
-
Measure full-fixture PPF
PAR Meter Protocol
-
Eliminate ambient light
-
Standardize reflective surfaces
-
Control temperature/humidity
-
Fixed measurement distances
-
Multi-point sampling
Conclusion
Achieving 3.0 μmol/J requires premium components, precision engineering, and rigorous testing. Beware of:
• Fake components in budget lights
• Misleading “lab peak” claims
• Improper spectral balance
Industry PPE Benchmark:
| Tier | PPE (μmol/J) | Category |
|---|---|---|
| Basic | 1.8-2.4 | Entry-level |
| Mainstream | 2.5-2.8 | Commercial-grade |
| Premium | 2.9-3.0 | Professional |
| Theoretical | 3.0+ | Lab conditions |
Growers should prioritize spectral quality over PPE claims, verify suppliers through factory audits/component testing, and align purchases with actual cultivation needs.
CATEGORIES
Recommended Post

Where It’s Legal to Grow Cannabis: Ultimate Tips & Cultivation Laws
About Author—Jose Li
Jose, a senior content creator at BATA LED, brings over 5 years of expertise in LED grow light. He delivers valuable insights to help growers and farmers better understand LED grow light technology, empowering them to boost crop yields and quality with advanced lighting solutions.


